Hi, I would like to see my spending comparison month to month on a bigger time scale (a year). Currently I can only compare one period to another as 2 numbers (i.e June to May, or 2024 to 2025). Also I can see accumulated spending over year as a line. For me this is not helpful. I can’t compare how my December spending is different from April and from September and what is the trend on one line because the graph is accumulative. I have added an example from Octopus Energy. They show it as bar charts but it can be also a line like in Emma but have some toggle to disable accumulative

6 Likes
Hey @Vadym,
thanks for raising this - we could probably improve the yearly filter I guess? If the year is selected we show the months instead of the cumulative data.
2 Likes
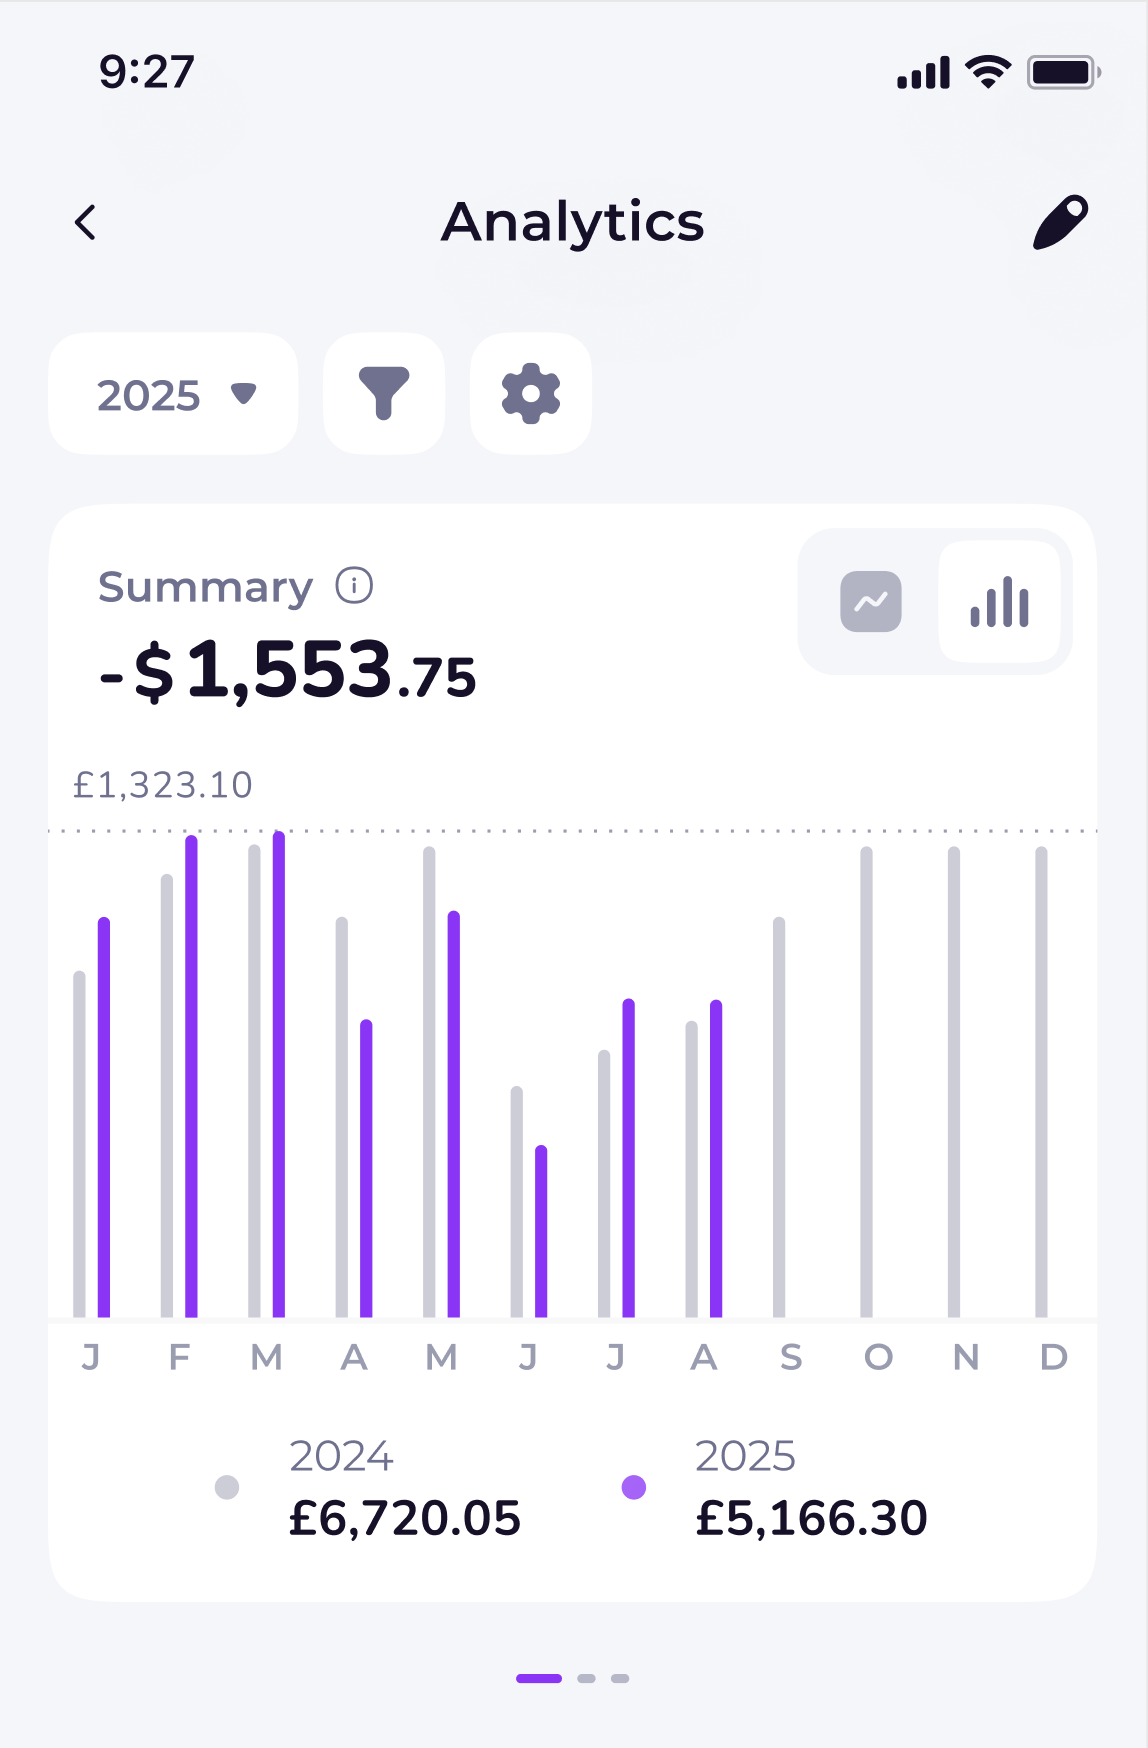
Hey @edoardomoreni , I have quickly drafted how it could look in UI. Sorry, I don’t have all of your context and product goals, but as a user this would be more useful for me to track my spendings. Hope it will be useful.


5 Likes
I agree with you - this makes 100% sense; I’ve passed it to the product team and we’ll prioritise it. ![]()
2 Likes
Huge fan of this
3 Likes
Personally i think this should be the default view, adds context to the analytics or at least a way to set it to be the default view would be great
4 Likes
This view preference is stored in the local memory of the phone, so even today you can make the piechart the default
Great, stuff looking forward to testing it out
1 Like
Just to let you know, we have an internal ticket for this - we’ll do it.
5 Likes
This would be so helpful, thanks for raising it.
1 Like
Hi guys, we made a recent update which allows you to switch between a cumulative graph and a monthly comparison graph. You’ll find a switcher on the top right of the graph section when you select the ‘Spend over time’ chart type and filter by ‘Yearly’ period, so please try it out ![]()
1 Like
Amazing! Thanks a lot for listening for feedback and prioritising it. You’re a truly user-centered. Love it ![]()
4 Likes
Is there a way to print these that I’m missing? If not, can that be added to a “request” list? For all reporting, really.
What do you mean by printing? ![]()
In order to save or export it somehow. I use year end spending summaries for my taxes and I review them with my husband on a regular basis.
1 Like