I love the networth graphs and all the other ones the preset dates are good but would be great if we could set our own date range similar to how it has been added to analytics. Pick start and end day and show the graph between those 2 points. Handy as i want to look beyond 1 year or more specific dates
We are going to do this and align the date ranges with the ones in the stocks (up to 5 years).
The filter is actually a nice idea too, we can have a look at it - I am not sure how to fit it in, but an option. ![]()
I think adding a clock to the top next to the + and refresh symbol would be like perfect then opens a menu to pick both dates start and end
I am not sure if we should edit the account balances as well at that point or just modify the graph ranges?
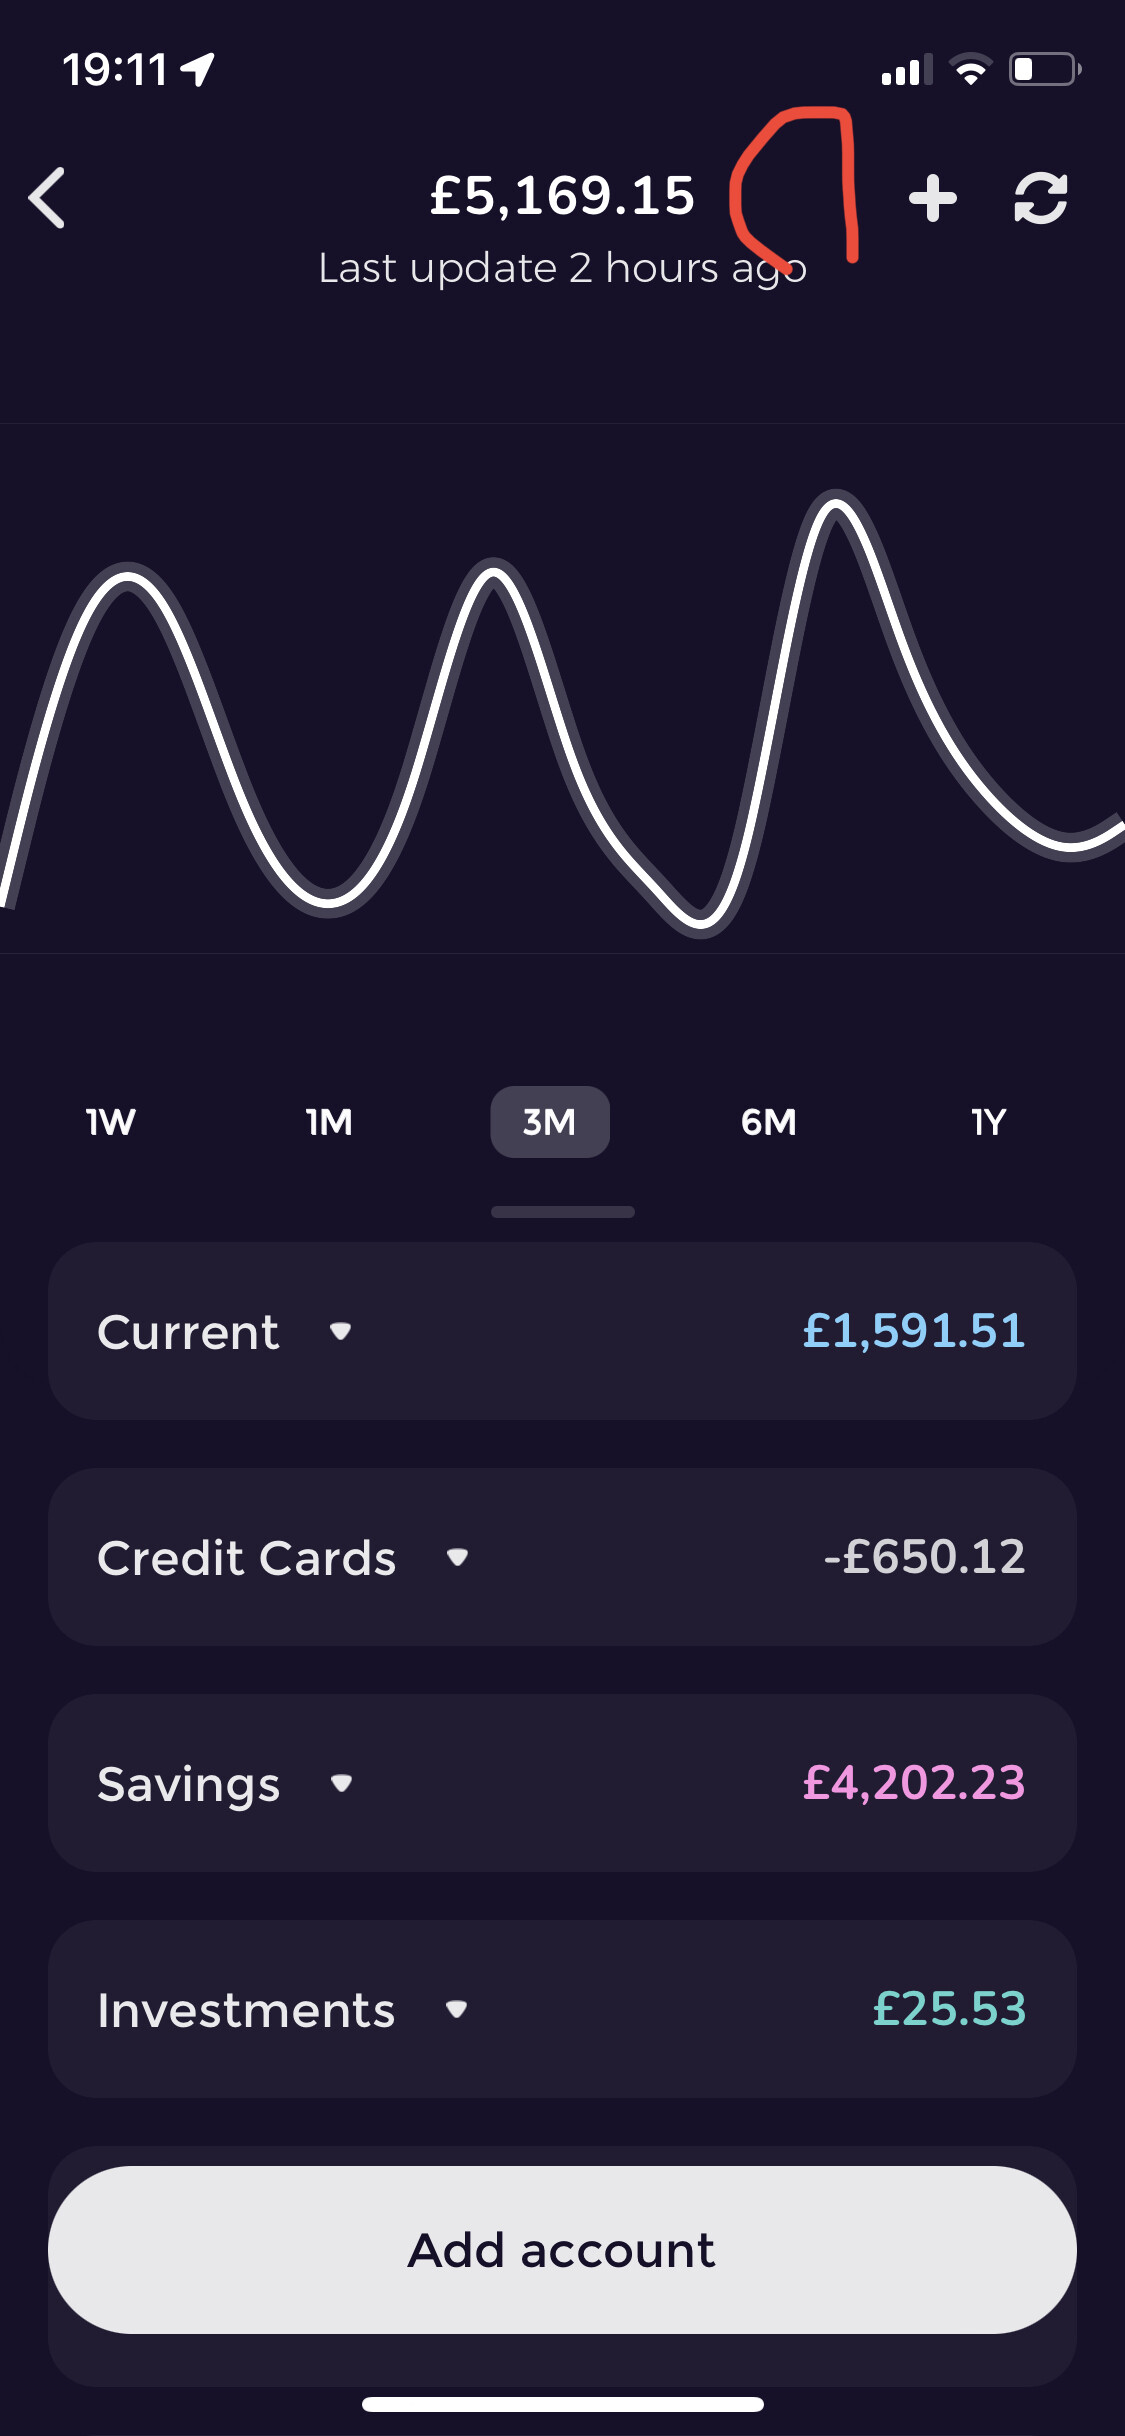
I think a button here would be perfect, or just a button to pick ranges. But as a start changing the ranges would be good but again still limited to pre sets.
By the way, we have made the change and removed 1W in favor of ALL after 1Y which basically stands for a 5 years range. This is coming next week, we are testing it now. ![]()
Any roughy timeframe of adding a select date range feature?
This is not in the pipeline yet. ![]()